East coast of South America commodities ranking
Oct, 17, 2021 Posted by Ruth HollardWeek 202139
Exports via container along the East Coast of South America grew 4% in the first eight months of 2021 compared to the same period in 2020. Imports grew 28% in the same period.
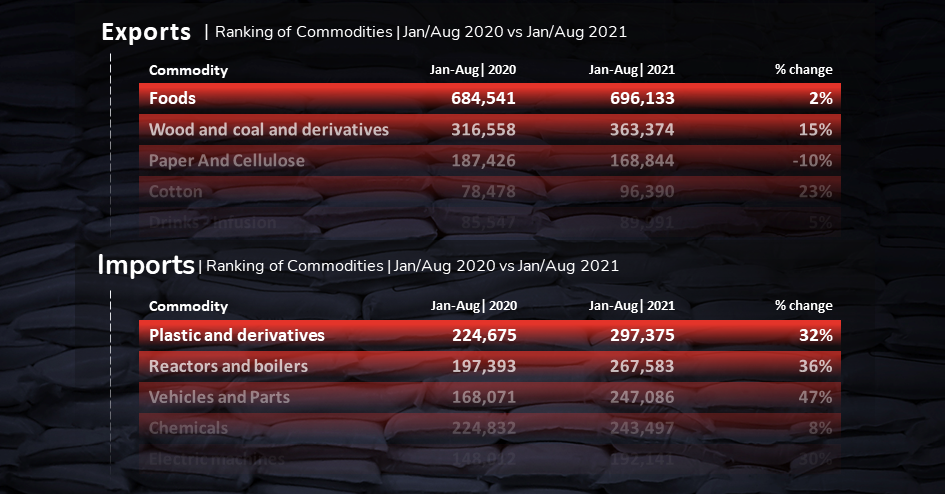
The Food category drove exports, which grew 2% in the same comparison, with 696,133 TEUs. The second category in the ranking was wood and derivatives, which grew 15% in the period.
Container exports along the East Coast of South America | Jan to Aug 2020 / 2021 | TEU
| wdt_ID | Classificação | Mercadoria | Jan-Ago | 2020 | Jan-Ago | 2021 | % mudança |
|---|---|---|---|---|---|
| 1 | 1 | Alimentos | 684.541 | 696.133 | 2% |
| 2 | 2 | Madeira e carvão e derivados | 316.558 | 363.374 | 15% |
| 3 | 3 | Papel e Celulose | 187.426 | 168.844 | -10% |
| 4 | 4 | Algodão | 78.478 | 96.390 | 23% |
| 5 | 5 | Bebidas - Infusão | 85.547 | 89.991 | 5% |
| 6 | 6 | Metais e derivados | 106.943 | 89.728 | -16% |
| 7 | 7 | Químicos | 81.845 | 86.035 | 5% |
| 8 | 8 | Plástico e derivados | 108.802 | 84.945 | -22% |
| 9 | 9 | Sementes e palhas | 73.415 | 64.974 | -11% |
| 10 | 10 | Açúcar e derivados | 80.581 | 62.852 | -22% |
| 11 | 11 | Reatores e caldeiras | 47.709 | 56.520 | 18% |
| 12 | 12 | Ração Animal | 48.172 | 47.484 | -1% |
| 13 | 13 | Artigos Têxteis, derivados e vestuário | 41.125 | 47.436 | 15% |
| 14 | 14 | Minerais e derivados | 34.785 | 40.563 | 17% |
| 15 | 15 | Ceramica | 26.511 | 39.243 | 48% |
| 16 | Total | 2.002.438 | 2.034.512 | 2% | |
| 17 | Outros | 289.049 | 337.672 | 17% | |
| 18 | Grande Total | 2.291.487 | 2.372.184 | 4% |
Source: DataLiner (To request a DataLiner demo click here)
Plastics and its Derivatives drove imports, with 297,375 TEU, a growth of 32% compared to the first eight months of 2020. The biggest drop was in the Fertilizer category, which fell 7%.
Container imports along the East Coast of South America | Jan to Aug 2020 / 2021 | TEU
| wdt_ID | Classificação | Mercadoria | Jan-Ago | 2020 | Jan-Ago | 2021 | % mudança |
|---|---|---|---|---|---|
| 1 | 1 | Plástico e derivados | 224.675 | 297.375 | 32% |
| 2 | 2 | Reatores e caldeiras | 197.393 | 267.583 | 36% |
| 3 | 3 | Veículos e peças | 168.071 | 247.086 | 47% |
| 4 | 4 | Químicos | 224.832 | 243.497 | 8% |
| 5 | 5 | Máquinas elétricas | 148.012 | 192.141 | 30% |
| 6 | 6 | Metais e derivados | 123.843 | 175.878 | 42% |
| 7 | 7 | Artigos Têxteis, derivados e vestuário | 102.608 | 132.791 | 29% |
| 8 | 8 | Borracha e derivados | 66.917 | 101.677 | 52% |
| 9 | 9 | Papel e Celulose | 59.570 | 72.056 | 21% |
| 10 | 10 | Alimentos | 71.792 | 69.140 | -4% |
| 11 | 11 | Adubo | 46.291 | 42.896 | -7% |
| 12 | 12 | Mobília | 30.315 | 38.397 | 27% |
| 13 | 13 | Vidro e derivados | 26.217 | 33.769 | 29% |
| 14 | 14 | Combustíveis | 19.554 | 32.204 | 65% |
| 15 | 15 | Bebidas | 27.834 | 31.212 | 12% |
| 16 | Total | 1.537.924 | 1.977.702 | 29% | |
| 17 | Outros | 305.192 | 377.575 | 24% | |
| 18 | Grande Total | 1.843.116 | 2.355.277 | 28% |
-
Other Cargo
Apr, 20, 2022
0
Paraguay increases its footwear exports to Brazil by more than 300%
-
Blog News (ENG)
May, 03, 2024
0
Uruguay: Exports grow 27% interannually in April
-
Trade Regulations
Mar, 06, 2023
0
Argentina, IMF discussing export-linked reserve targets
-
Automotive
Jul, 14, 2023
0
Vila Velha Terminal chosen to receive 3,000 cars on COSCO ship

