Global landscape impacts Brazil footwear exports
Aug, 10, 2023 Posted by Gabriel MalheirosWeek 202333
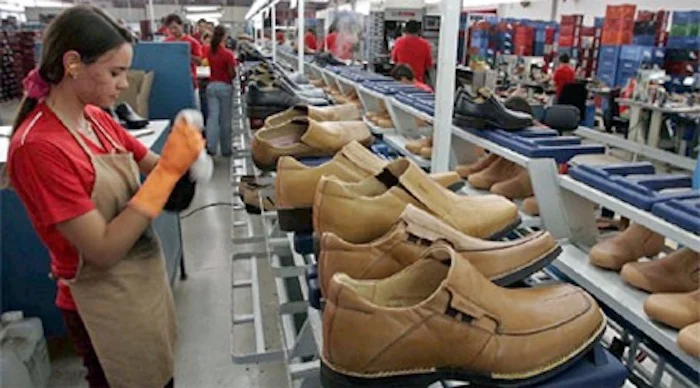
The global landscape, characterized by growth deceleration and high inflation rates, continues to exert pressure on footwear exports from Brazil. In July, data compiled by the Brazilian Association of Footwear Industries (Abicalçados) revealed that 8.18 million pairs were shipped, yielding $101 million. These figures represent a decline in both volume (-31.3%) and revenue (-9.6%) compared to the same month in 2022. Over the span of the first seven months of the year, exports amounted to 72.93 million pairs, generating $727.55 million – reflecting drops of 16% and 4.7%, respectively, compared to the corresponding period last year. Despite these setbacks, in contrast to the pre-pandemic era of 2019, the sector maintains positive export indices: 11.4% growth in volume and 28.3% in revenue.
Haroldo Ferreira, the Executive President of Abicalçados, attributes the decline in footwear exports to reduced dynamism in the global economy, particularly in the United States, which now stands as the second-largest destination for Brazilian footwear after being overtaken by Argentina. “Footwear manufacturers are also facing challenges in Argentina, which was a driving force behind our significant growth last year. Accessing the foreign exchange market and extended import payment periods of up to six months have posed difficulties,” remarks Ferreira. He adds that elevated international interest rates have contributed to the efforts to control inflation, further impacting consumption dynamics in various countries.
See below a chart displaying Brazilian shipments of footwear (hs codes 6400-6406), measured in TEUs, from Jan 2019 and Jun 2026. The data is from DataLiner.
Footwear exports from Brazil | Jan 2019 – Jun 2026 | TEU
Source: DataLiner (click here to request a demo)
Destinations
Argentina remains the primary destination for Brazilian footwear exports, importing 9.36 million pairs valued at $149.5 million between January and July. This marks an 8.3% drop in volume coupled with a 36.2% increase in revenue compared to the same period last year. The second-largest recipient over these seven months was the United States, receiving 6.3 million pairs worth $136.32 million – representing declines of 51.4% and 34.6%, respectively, compared to 2022. Completing the roster of top destinations for Brazilian footwear is France, where 2 million pairs were dispatched, generating $36.7 million. This reflects a decline of 59% in volume and 10.3% in revenue compared to the same period in the prior year.
States
Rio Grande do Sul retains its status as Brazil’s primary footwear exporter, with 21.43 million pairs leaving its factories and generating $328.36 million between January and July. These figures indicate respective drops of 16.6% and 8.2% compared to the same period in the preceding year.
Ceará ranks second among exporters, shipping 22.4 million pairs valued at $168.2 million. This signifies a 12.7% decrease in volume and a 6.5% increase in revenue compared to the corresponding period in 2022.
São Paulo and Bahia round out the roster of major footwear exporters. São Paulo dispatched 4.7 million pairs worth $66.8 million – representing declines of 24% and 14.2%, respectively. Bahia shipped 2.57 million pairs and generated revenue of $53 million, reflecting a 5.8% decrease in volume and a 33.7% increase in revenue compared to the same period in 2022.
Imports surge
In contrast to exports, the upward trajectory of footwear imports remains unabated. Within the first seven months of the year, Brazil saw the entry of 18.9 million pairs, amounting to $273.86 million. These figures indicate increases both in volume (+11.2%) and revenue (+34%) compared to the corresponding period last year. Focusing solely on the month of July, the numbers rise even higher. In this single month, 2 million pairs were imported into Brazil, commanding $47 million. This reflects a substantial surge of 34.7% in volume and a remarkable 81.6% in revenue compared to the same period in 2022.
Asian nations remain the dominant sources of imports. Collectively, China, Vietnam, and Indonesia contribute to over 86% of the total pairs imported during this period. China continues to be the foremost contributor in terms of volume. Over the course of seven months, China exported 7.9 million pairs to Brazil, garnering $32.62 million. This translates to a modest 5% decrease in volume but a noteworthy 7.4% increase in revenue compared to the same period in 2022. Following closely is Vietnam, with 5.9 million pairs and $133.73 million – signifying remarkable surges of 31% and 42%, respectively – and Indonesia, contributing 2.52 million pairs and $51 million, reflecting substantial growths of 44.8% and 44.3%, respectively.
When isolating the data for the month of July, imports from the three Asian nations, in terms of revenue, experienced an average growth of 98.8% compared to the same month in 2022. “The heightened influx of Asian imports naturally raises concerns within the national industry. Furthermore, imports via cross-border platforms, not accounted for in the statistics, exacerbate the challenges facing our sector,” Ferreira explains, citing the tax exemption for products valued up to $50 marketed through international digital platforms.
In the realm of footwear components – uppers, soles, heels, insoles, etc. – imports for the initial seven months summed up to $16.47 million, signifying a 5% increase compared to the same period in 2022. The primary origins of these imports were China, Vietnam, and Paraguay.
-
Ports and Terminals
Oct, 13, 2022
0
Antaq: number of inspections at Brazilian ports increase 26.4% in 3Q22
-
Meat
Sep, 28, 2021
0
BRF plants receive certification to sell pork offal to Singapore
-
Ports and Terminals
Nov, 08, 2023
0
Disqualified Companies File Request to Suspend Port of Itajaí Auction
-
Shipping
Jul, 28, 2021
0
Tietê-Paraná Waterway cargo movement will be interrupted in August due to water rationing


