


Anfavea data reveals extent of Coronavirus impact on automotive industry in March
Apr, 06, 2020 Posted by datamarnewsWeek 202015
Anfavea, the National Motor Vehicle Manufacturers Association, released results on Monday 06/04) of how the industry performed in March, already heavily affected by the COVID-19 crisis in the last two weeks of the month.
After two weeks of strong activity in the domestic market, pointing to robust growth, a gradual halt in trade and factories can be observed to the tune of almost 90% of the sector’s activities. “We had two very different moments in March. Until the beginning of the second half of the month sales were on the rise with 9% cumulative growth in the year until then compared to last year. But the advance of the pandemic in our country caused an interruption of activities in factories and concessionaires, that 9% growth turned into an 8% cumulative drop in the year so far by the end of the month,” explained Luiz Carlos Moraes, president of Anfavea. According to him, with sales having plunged nearly 90% in the last two weeks of March, April looks rather worrying.
The end result was that production, exports and licenses in March 2020 dropped 21% year-on-year. In comparison with February, the drop in March was 18% in terms of jobs and exports, and 7% for production.
Essential activities
Different to cars, the market for buses and trucks as well as agricultural and road machinery, still managed to register positive growth in March, since most of the factories that produce these were functioning until the beginning of April and sales were heated due to the harvest season. In comparison with the previous month, sales increased 46%, exports 19% and production 15%. Agricultural machinery manufacturers have guaranteed enough stock to serve farmers, as their activities are considered essential, with or without a pandemic. Another activity that continues without dipping is technical assistance and distribution of parts for machines and trucks.
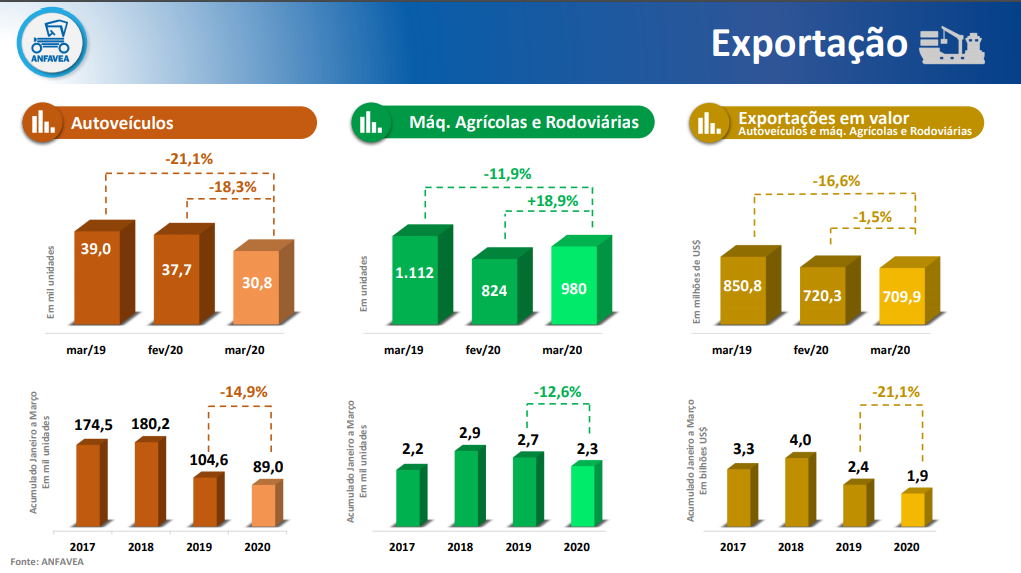
The following graph shows vehicle exports in March 2020 compared with February 2020 and March 2019:

The following graph shows the production and export of light vehicles from Brazil between January 2011 and March 2020:
The chart below shows the production and export of CKD from Brazil between January 2011 and March 2020:
The graph below the production and export of Brazilian trucks between January 2011 and March 2020:
Source: Anfavea
-
Shipping
Dec, 04, 2018
0
Update on Far East services
-
Ports and Terminals
Jul, 09, 2020
0
Itajaí Port concludes expropriation phase
-
Ports and Terminals
Oct, 09, 2023
0
Brazilian ports face 15-year infrastructure lag
-
Meat
Dec, 13, 2023
0
Russia audits 11 cold storage plants in preparation for Brazilian beef and poultry exports