July data: imports fight back; exports gain strength
Aug, 31, 2020 Posted by datamarnewsWeek 202036
July data from DataLiner, which will be released today, shows that imports into the East Coast of South America rallied when compared to the previous months. They are still severely down compared to the last two years but have recovered in line with expected seasonal volumes. Exports in the meantime have surged further, going from strength to strength.
The chart below shows cargo imports from the East Coast of South America for the first seven months of 2020 compared with the same period in 2018 and 2019:
Imports into the East Coast of South America | Jan to July 2018-2020 (TEU)
Source: DataLiner
In the graph, it is possible to see that until February 2020, imports maintained a good level, outpacing the same months in 2019. As of April, however, when the impact of the quarantine due to the pandemic began to be felt in earnest, they plummeted, reaching the lowest level in June. A recovery has been seen in July, with imports growing 23.3% in relation to the previous month. Even so, the volume is 29.5% lower than in July 2019.
Economic Analysis
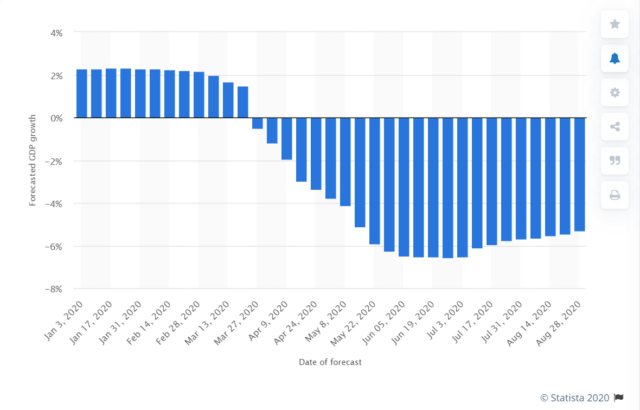
2020 GDP forecasts for Brazil have continued to improve in the meantime. Currently, the forecast is for a recession of 5.28%. Back in July, the forecast stood at a 6.5% recession.
The graph below shows the cumulative result for Brazilian imports in the first seven months of 2020 compared to the same period in 2019 and 2018.
Imports into the East Coast of South America | Jan to July 2018-2020 (TEU)
Source: DataLiner
The cumulative total in the above graph for January to July 2020, shows a 10.46% fall in imports compared with the same period in 2019 and 15.83% in relation to 2018 in TEU.
2020 Forecast GDP Growth for Brazil
Source: Statista
Commodities Analysis
Many of the most affected imports into the East Coast of South America’s saw numbers bounce back in July after what appears to have been the low point in June, as can be seen in the table below. August numbers are also expected to rise following a very limited number of blank sailings during that month according to Datamar databases.
Ranking of the most imported goods in July 2020
| wdt_ID | Commodity | Jan | Feb | Mar | Apr | May | Jun | Jul | May-Jun Change | Jun-Jul Change |
|---|---|---|---|---|---|---|---|---|---|---|
| 1 | 39 - Plastics and Articles Thereof | 33.498 | 30.426 | 31.184 | 33.573 | 26.626 | 20.570 | 23.317 | -6.055 | 2.747 |
| 2 | 84 - Nuclear Reactors and Mechanical Appliances | 31.800 | 26.172 | 22.624 | 26.952 | 23.180 | 17.771 | 22.048 | -5.408 | 4.276 |
| 3 | 85 - Electrical Machinery and Equipment and Parts Thereof | 24.008 | 22.829 | 17.782 | 20.253 | 16.532 | 10.963 | 15.476 | -5.569 | 4.513 |
| 4 | 29 - Organic Chemicals | 12.761 | 11.602 | 11.119 | 14.307 | 13.158 | 11.666 | 13.021 | -1.492 | 1.355 |
| 5 | 87 - Vehicles Other Than Railway or Tramway Rolling-Stock | 29.297 | 23.870 | 27.321 | 27.581 | 14.634 | 9.763 | 11.493 | -4.870 | 1.730 |
| 6 | 38 - Miscellaneous Chemical Products | 6.762 | 5.983 | 5.702 | 5.988 | 6.989 | 7.187 | 8.400 | 198 | 1.213 |
| 7 | 40 - Rubber and Articles Thereof | 10.865 | 10.098 | 9.594 | 9.714 | 7.626 | 4.250 | 6.690 | -3.375 | 2.439 |
| 8 | 31 - Fertilisers | 5.034 | 4.931 | 4.235 | 6.772 | 6.666 | 6.813 | 6.045 | 147 | -769 |
| 9 | 28 - Inorganic Chemicals | 5.795 | 5.537 | 5.086 | 6.296 | 5.598 | 5.342 | 5.116 | -256 | -226 |
| 10 | 48 - Paper and Paperboard | 7.075 | 6.704 | 6.249 | 7.014 | 5.980 | 4.443 | 4.503 | -1.537 | 60 |
Source: DataLiner
(To request a Dataliner demo click here)
-
Other Cargo
Mar, 20, 2024
0
Exports pick up pace for Brazilian cotton market
-
Grains
Dec, 03, 2018
0
Argentina expects bumper wheat harvest this month
-
Trade Regulations
Aug, 12, 2020
0
Brazil investigates dumping accusation against Chinese aluminium laminate exports
-
Shipping
May, 23, 2023
0
Global container production falls as demand for goods sinks


