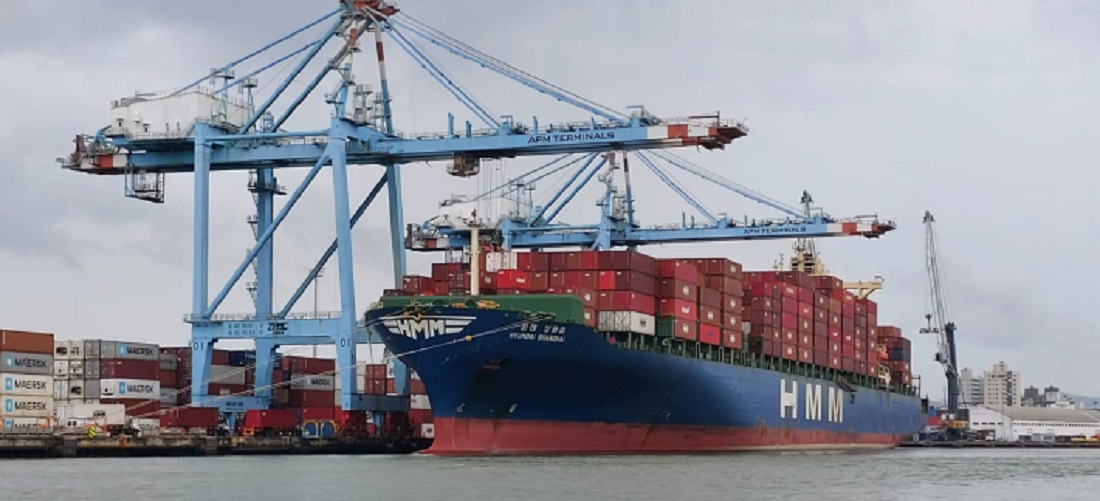
Itajaí and Navegantes Port Complex saw a 6% increase in general cargo handling
May, 30, 2022 Posted by Gabriel MalheirosWeek 202222
Last April, the Itajaí and Navegantes Port Complex handled 126,561 TEUs, equivalent to 1,395,851 tonnes.
In total, in April, the Port Complex recorded 77 vessel berthings, 25 at APM Terminals (right bank/leased area), five at TEPORTI, and one at the Brazilian Navy’s hold at the Port of Itajaí. At Portonave (Navegantes Port Terminal), the movement recorded in the month totaled 47 calls, 97,578 TEUs, and 1,039 tonnes.
Also, still in April, 77 vessels made their turns in the complex, with 39 ships doing so in the Basin 01 area (in front of the Port of Itajaí and Port of Navegantes). On the other hand, 29 vessels used Basin 02 (the new Maneuvering Basin of the Port Complex).
At the Port of Itajaí (public berths and APM Terminals/leased area), 26,537 TEUs were handled with 330,247 registered tonnes. These numbers represent stability in transactions compared to the same period last year.
According to Fábio da Veiga, Itajaí’s superintendent, the numbers seen in the port complex in April indicates the growth in operations shall continue throughout the first semester and possibly for the rest of the year.
“The 6% increase in TEUs handled in April demonstrates the consolidation of a growth occurring continuously in recent years,” Fábio says.
Concerning the first four months of this year (January to May), the Port Complex of Itajaí and Navegantes recorded 327 berths. The accumulated number of turns in Basin 01 was 169, and Basin 02 totaled exactly 128 maneuvers performed.
The participation of the Port of Itajaí during April in the Brazilian trade flow was 3.5%, while its share for the state of Santa Catarina was 58.2%.
The main products exported during April were: Wood and Derivatives (43.96%), Frozen Chicken (18.82%), Meat (beef and pork 10.27%), Mechanical and Electronics (7.48%), Ceramics and Glass (5.09%). On the other hand, the most significant imports within the same month were Chemicals (38.32%), Mechanical and Electronics (20.50%), Miscellaneous Textiles (12.51%), Food in General (11.58%), Plastics and Rubber (8.68%).
-
Grains
Apr, 28, 2021
0
Mexican market confirmed as open to Brazilian rice exports
-
Trade Regulations
Dec, 23, 2019
0
China will reduce import tariffs on 850 products in 2020
-
Sugar and Ethanol
Apr, 24, 2019
0
Brazil expects record ethanol production in 2018/19
-
Automotive
Mar, 08, 2019
0
Volkswagen vies to fill Ford’s production gap while Lifan closes in Uruguay


