


Brazilian study points to high GDP per capita in commodity producing regions
Feb, 10, 2020 Posted by Sylvia SchandertWeek 202007
Brazilian municipalities responsible for generating the most revenues in cotton, corn and soybean production also contributed the highest percentages towards GDP per capita in the country’s main agricultural municipalities. The conclusion was drawn in a study by the Department of Financing and Information of the Secretariat of Agricultural Policy, of the Ministry of Agriculture, Livestock and Supply.
The study cross-referenced municipalities’ data provided by the Municipal Agricultural Survey (PAM), of the Brazilian Institute of Geography and Statistics (IBGE), with GDP per capita data from 2017. Twenty municipalities were selected that represent 59% of the country’s production value of soy, corn, beans, sugarcane, coffee, cotton, rice, cocoa and oranges were selected.
“These municipalities have a GDP per capita more than twice as high as the national average (R$ 31,834.00). Campos de Júlio (MT) has a GDP per capita of R$ 190,239, six times higher than the national average. Sapezal (MT) had a GDP per capita of R$ 103,552 in 2018, more than three times the country’s average GDP per capita”, said José Garcia Gasques, general coordinator of Policy Assessment and Map Information.
Other municipalities, such as Diamantino (R$ 91,907) and Nova Ubiratã (R$ 90,449), also registered a GDP per capita high above the national average.
The municipalities that lead production value in cotton, corn and soy have had the greatest impact on GDP per capita. Behind them came sugarcane, beans and orange producing areas. And the regions with the lowest GDP per capita are coffee, cocoa and rice, with GDP per capita about 20% to 30% below the national average.
“These results show that the regions that have incorporated increasing levels of technology have also been leading the generation of income in agriculture. In this race, commodities that struggle to part with traditional production patterns are falling behind, which has led to the impoverishment of important Brazilian regions ”, concludes Gasques.
Classification of the main agricultural municipalities according to GDP per capita (2017) *

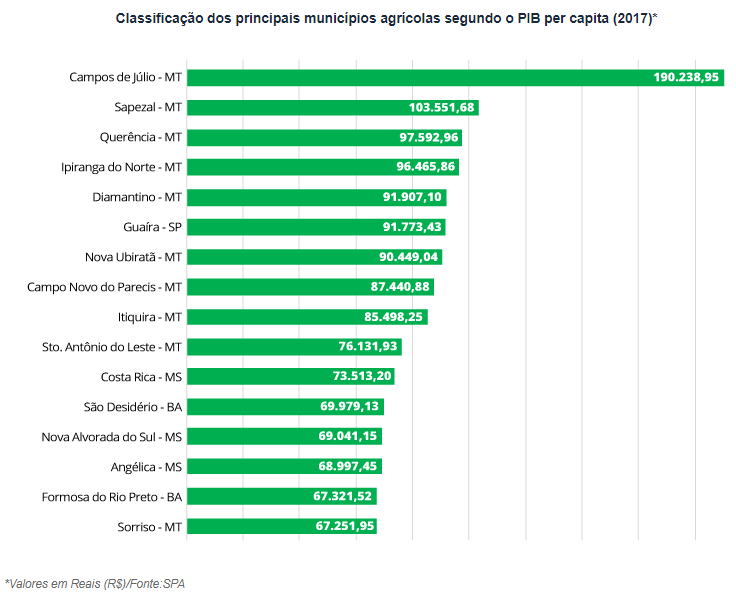
* Amounts in Reais (R$) / Source: Agricultural Policy Secretariat
-
Ports and Terminals
Oct, 08, 2021
0
Salvador receives 20,000 tons of rails for FIOL II stretch
-
Trade Regulations
Dec, 06, 2023
0
Brazil secures exports of flavor enhancers to Thailand
-
Other Cargo
Jan, 18, 2023
0
New record set: Brazil-US trade reaches US$ 88.7 billion
-
Shipping
Mar, 10, 2023
0
MSC receives largest container ship in the world