


3rd week of January trade balance registers US$ 0.824 billion deficit
Jan, 26, 2021 Posted by Ruth HollardWeek 202104
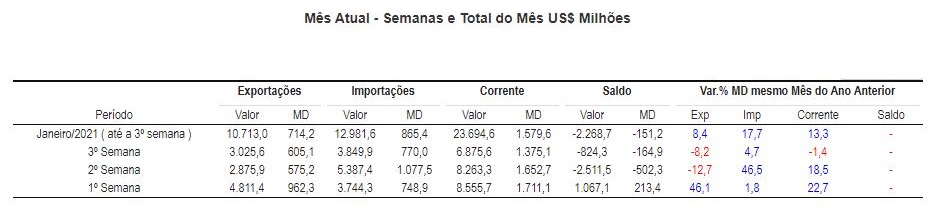
The Brazilian trade balance registered a deficit of US$ 0.824 billion for the third week of January 2021 – with five working days – with US$ 3.026 billion of exports and US$ 3.85 billion of imports. The data were released on January 25 by SECEX, the foreign trade secretariat of the Ministry of Economy.
Cumulative exports for the month totaled US$ 10.713 billion and cumulative imports totaled US$ 12.982 billion, resulting in a balance of US$ -2.269 billion for the month.
Trade balance

Analysis of the month
Comparing the daily average until the third week of January 2021 (US$ 714.2 million) with that of January 2020 (US$ 658.84 million), there was an increase of 8.4% in exports due to increased sales of products from the Extractive Industry (28.1%), Agriculture and Livestock (0.4%), and the Manufacturing Industry (2.1%).
The increase in exports was mainly driven by growth in sales of the following products from the Extractive Industry: Iron ore and concentrates (+ 65.8%); Copper ore and concentrates (+ 80.1%); Other crude minerals (+ 18.5%); Other ores and concentrates of base metals (+ 15.9%) and Stone, sand and gravel (+ 28.8%). Regarding the Manufacturing Industry, the highlight was the growth in sales of sugars and molasses (+ 43.6%); Soybean meal and other animal feed, excluding unground cereals, meat, and other animal meal (+ 36.9%); Gold, non-monetary, excluding gold ores and concentrates, (+ 29.7%); Pig iron, spiegel iron, sponge iron, iron or steel granules, and powder and iron alloys (+ 24.6%); and Tobacco, decaulified or denervated (+ 77.2%). Finally, the increase in exports also included growth in sales of the following agricultural products: Unground corn, except sweet corn (+ 55.7%); Unroasted coffee (+ 38.0%); Raw cotton (+ 15.3%); Wheat and rye, unground (+ 304.4%), and Spices (+ 66.1%).
In imports, the daily average until the third week of January 2021 (US$ 865.44 million) was 17.7% above the average of January last year (US$ 735.37 million). In this comparison, spending increased, mainly due to Agriculture (9.1%), Manufacturing Industry (15.8%), and the Extractive Industry (19.8%).
The increase in imports was mainly driven by the growth in purchases of the following agricultural products: Wheat and rye, unground (+ 17.0%); Unground corn, except sweet corn (+ 75.7%); Soy (+ 244.7%); Barley, unground (+ 138.8%), and raw vegetable materials (+ 21.7%).
With regard to the Manufacturing Industry products, the increase in imports is mainly due to the growth in the purchase of Platforms, vessels, and other floating structures (+ 42.1%); organic or chemical fertilizers, except raw fertilizers, (+ 36.9%); Thermionic valves and tubes, cold cathode or photo-cathode, diodes, transistors (+ 20.4%); Plastic tubes, pipes and hoses, and their accessories (+ 221.0%), and Other products from the chemical industry (+ 67.5%). In relation to the Extractive Industry, the increase in imports was driven by the growth in purchases of Natural gas, liquefied or not (+ 73.2%); Iron ore and concentrates (+ 195,237.8%); Other base metal ores and concentrates (+ 45.2%), and Other crude minerals (+ 34.3%).
-
Other Cargo
Dec, 14, 2022
0
Brazil hopes to become world’s largest cotton exporter in 2023, surpassing U.S.
-
Economy
Nov, 08, 2021
0
Trade balance records a surplus of US$ 58.47 billion YTD, up 32.5%
-
Ores
Jul, 28, 2021
0
Record-breaking Q2 profit of R$ 2.501 bi for CSN Mineração
-
Grains
Jan, 29, 2024
0
Argentina secures key wheat import market